Telemetry and Metrics
Gateway Telemetry Metrics
Akeyless Gateway telemetry metrics provide time-series data about the Gateway application and runtime environment. You can use these metrics to build dashboards, configure alerts, and monitor Gateway health, resource usage, API traffic, SaaS connectivity, and account quota usage.
Starting from Akeyless Gateway v5.0.0, Gateway metrics are exposed through a dedicated metrics endpoint: https://<Your-Gateway-URL>:8000/metrics
The endpoint can be scraped or collected by monitoring and alerting solutions such as Prometheus and Datadog.
New telemetry endpointStarting from Akeyless Gateway v5.0.0, the legacy metrics solution is deprecated. Gateway metrics are now exposed through the
/metricsendpoint on port8000and can be collected by external monitoring solutions.
Overview
Gateway telemetry metrics help you monitor the operational status of your Gateway deployment.
You can use these metrics to track:
- Gateway pod health
- Connectivity to Akeyless SaaS backend services
- Gateway API traffic
- HTTP response status codes
- Account quota usage
- CPU, memory, disk, load, and network utilization
Collection Model
Akeyless Gateway exposes metrics through a pull-based /metrics endpoint.
Monitoring systems such as Prometheus can scrape this endpoint directly. If you use Datadog or another observability backend, you can collect these metrics through the backend's Prometheus scraping support or by using an OpenTelemetry Collector pipeline.
The Gateway does not store long-term metric history. Use an external metrics backend for historical analysis, dashboards, and alerting.
Prerequisites
Before enabling telemetry metrics, make sure that:
- Gateway v5.0.0 or later is deployed.
- Metrics are enabled on the Gateway.
- Port
8000is reachable from your monitoring system. - The monitoring system is configured with the correct
httporhttpsscheme. - For Kubernetes deployments, Prometheus or your monitoring agent can access the Gateway Service.
Available Metrics
The following metric families are currently available:
| Metric | Description |
|---|---|
akeyless_gw_system_cpu_* | CPU utilization metrics |
akeyless_gw_system_disk_* | Disk I/O metrics |
akeyless_gw_system_load_* | CPU load metrics |
akeyless_gw_system_memory_* | Memory utilization metrics |
akeyless_gw_system_network_* | Network interface I/O metrics and TCP connection metrics |
akeyless_gw_system_saas_connection_status | Gateway connectivity status to Akeyless SaaS services |
akeyless_gw_quota_current_transactions_number | Current total transaction count in the account |
akeyless_gw_quota_gw_admin_client_transactions | Total transactions made by the Gateway default identity |
akeyless_gw_quota_total_transactions_limit | Total hourly transaction limit for the account |
akeyless_gw_system_http_response_status_code | HTTP response status codes for requests served by the Gateway API |
akeyless_gw_system_request_count | Total requests issued directly against the Gateway API |
akeyless_gw_system_healthcheck_status | Gateway container health check status |
To monitor Gateway API traffic, use the following metrics together:
akeyless_gw_system_request_countakeyless_gw_system_http_response_status_code
The akeyless_gw_system_network_* metric family includes network interface and TCP connection behavior.
Metric Types and Usage Notes
Gateway telemetry includes different metric types.
Status metrics represent the current state of a Gateway pod. For example:
akeyless_gw_system_healthcheck_statusakeyless_gw_system_saas_connection_status
Counter metrics increase over time. For example:
akeyless_gw_system_http_response_status_codeakeyless_gw_system_request_count
When using Prometheus, use functions such as rate() or increase() for counter-based dashboards and alerts instead of using raw counter values.
Status Metrics
The following metrics report numeric status values:
akeyless_gw_system_healthcheck_statusakeyless_gw_system_saas_connection_status
Use the following values when building dashboards and alerts:
| Value | Meaning |
|---|---|
1 | Healthy or connected |
0 | Unhealthy or not connected |
What Each Status Metric Checks
| Metric | Description |
|---|---|
akeyless_gw_system_saas_connection_status | Checks connectivity from each Gateway pod to Akeyless SaaS backend services |
akeyless_gw_system_healthcheck_status | Checks connectivity from each Gateway pod to the local cache service, such as Redis or Supersonic cache |
These metrics are reported per Gateway pod. They are not replica counters.
Replica Scaling Behavior
When Gateway replicas are scaled down, removed pods stop exposing metrics. As a result, their time series may become stale in the monitoring system.
For example, if you scale from two replicas to one replica, the remaining healthy pod continues to report:
akeyless_gw_system_healthcheck_status = 1This does not mean the metric is stuck. It means the removed pod no longer exposes metrics.
To alert on replica availability, use Kubernetes metrics such as:
kube_deployment_status_replicas_availableHTTP Response Metric Behavior
akeyless_gw_system_http_response_status_code is a counter with status-code labels.
When using Prometheus, use rate() or increase() for alerts and dashboard calculations instead of using the raw counter value.
Example:
sum by (status_code) (
  rate(akeyless_gw_system_http_response_status_code[5m])
)
Enable Metrics on Docker
To enable Gateway telemetry metrics in a Docker deployment, set the ENABLE_METRICS environment variable to true:
docker run -d -p 8000:8000 -p 5696:5696 \
  -e GATEWAY_ACCESS_ID="Access-id" \
  -e GATEWAY_ACCESS_KEY="Access-key" \
  -e ENABLE_METRICS="true" \
  --name akeyless-gateway akeyless/base:latest-akeyless
After the container starts, metrics are available at: https://<Your-Gateway-URL>:8000/metrics
Use http instead of https if your Gateway endpoint is not configured with TLS.
Enable Metrics on Kubernetes
To enable Gateway telemetry metrics on Kubernetes, set globalConfig.metrics.enabled to true in your values.yaml file:
globalConfig:
  metrics:
    enabled: true
Configure Prometheus Scraping
To allow Prometheus to scrape Gateway metrics, annotate the Gateway Service:
gateway:
  service:
    annotations:
      prometheus.io/scrape: "true"
      prometheus.io/port: "8000"
      prometheus.io/scheme: "http"

globalConfig:
  metrics:
    enabled: true
Use prometheus.io/scheme: "https" if your Gateway metrics endpoint is exposed over HTTPS.
Datadog Dashboard
Akeyless is an official Datadog Partner, and the Akeyless Gateway dashboard is available through Datadog Integrations.
To use the dashboard:
- In Datadog, go to Integrations.
- Install the Akeyless Gateway integration.
- Go to Dashboards.
- Open the Akeyless GW dashboard.
You can also use Metrics Explorer and filter by: akeyless_gw
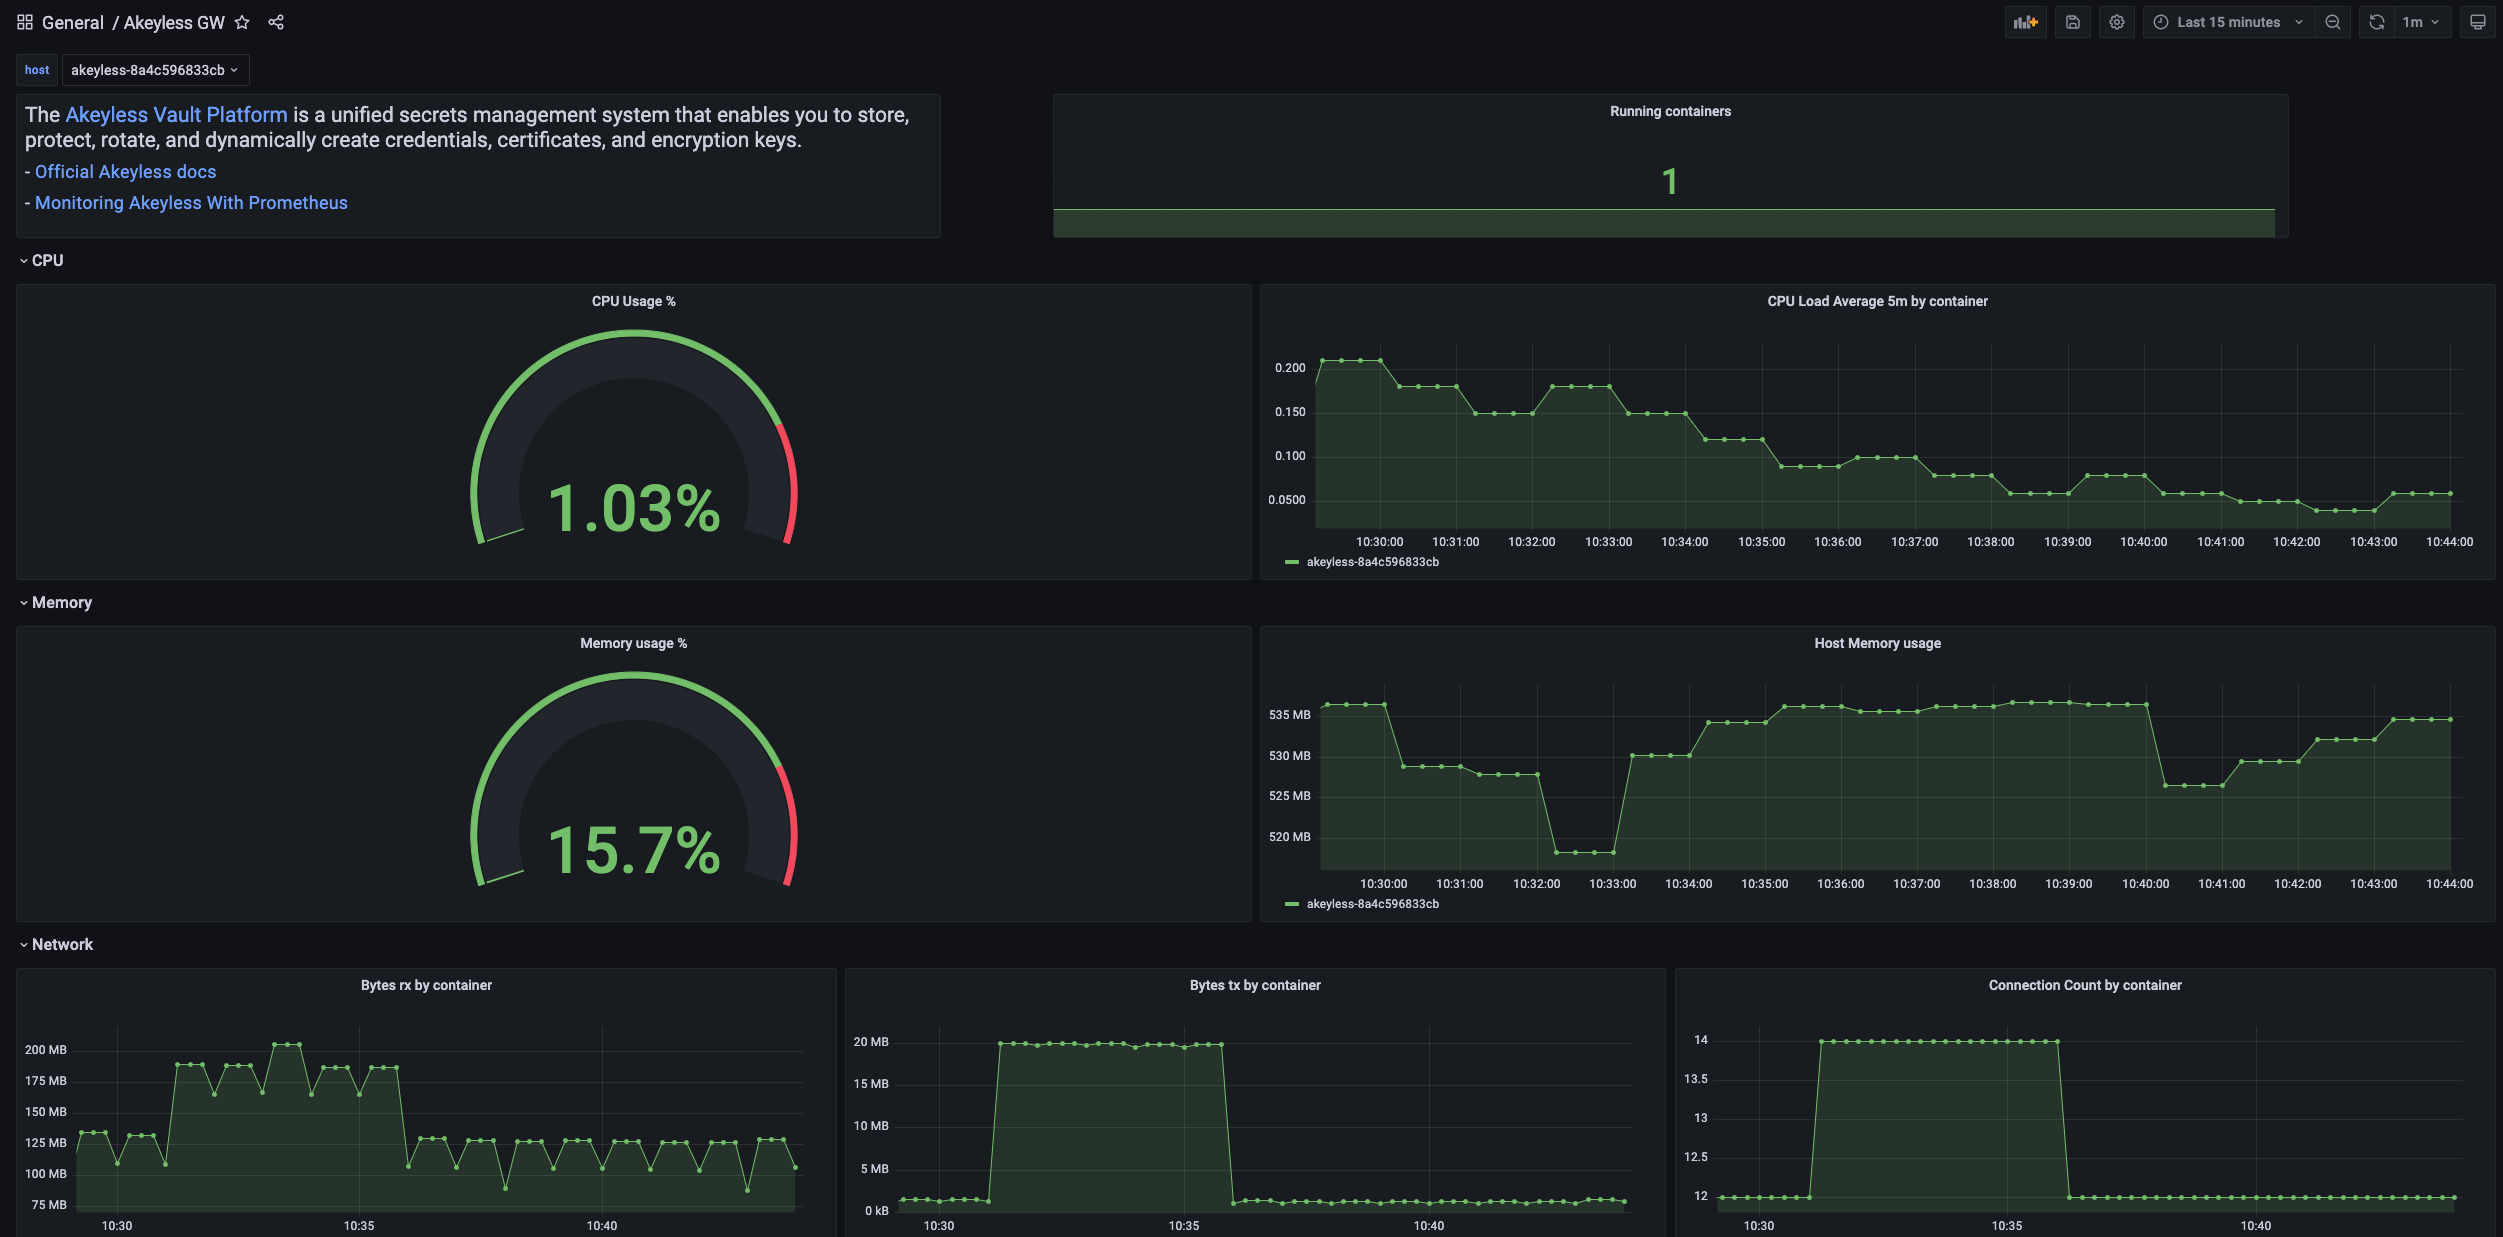
Grafana Dashboard with Prometheus
You can visualize Akeyless Gateway metrics in Grafana when using Prometheus as a data source.
Import the Akeyless Gateway dashboard from Grafana: Grafana dashboard 16927.
Optional: Use OpenTelemetry Collector
You can use the OpenTelemetry Collector to scrape Gateway metrics and export them to an observability backend.
In this flow, the Collector scrapes the Gateway /metrics endpoint and then exports the collected metrics to the selected backend.
For a full list of available exporters, see the OpenTelemetry Collector Contrib exporter page.
Gateway Application Log Forwarding
Gateway application logs are not exposed through the metrics endpoint.
To collect logs together with metrics, forward container logs from Docker or Kubernetes using your existing logging pipeline.
For Docker deployments, collect logs from the Gateway container.
For Kubernetes deployments, collect pod logs using your existing Kubernetes logging pipeline.
For more information, see Gateway Log Forwarding.
Metric Tag Configuration
You can enrich metrics with tags using OpenTelemetry semantic conventions.
When sending metrics through Datadog or an OpenTelemetry Collector, make sure that the required resource attributes are mapped to tags according to your monitoring backend configuration.
For Datadog mapping details, see Datadog OpenTelemetry semantic mapping.
Recommended Alerts
Consider configuring alerts for the following conditions:
| Area | Metric | Suggested Alert |
|---|---|---|
| Gateway health | akeyless_gw_system_healthcheck_status | Alert when the value is 0 for one or more pods |
| SaaS connectivity | akeyless_gw_system_saas_connection_status | Alert when the value is 0 for one or more pods |
| API errors | akeyless_gw_system_http_response_status_code | Alert on an increase in 5xx responses |
| API traffic | akeyless_gw_system_request_count | Alert on unusual traffic drops or spikes |
| Account quota | akeyless_gw_quota_current_transactions_number and akeyless_gw_quota_total_transactions_limit | Alert when usage approaches the hourly quota limit |
| System resources | akeyless_gw_system_cpu_*, akeyless_gw_system_memory_*, akeyless_gw_system_disk_* | Alert on sustained high resource usage |
Troubleshooting
Metrics endpoint is not available
Verify that metrics are enabled.
For Kubernetes deployments, check that the following value is configured:
globalConfig:
  metrics:
    enabled: true
For Docker deployments, verify that the container was started with:
-e ENABLE_METRICS="true"Also check that port 8000 is exposed and reachable from your monitoring system.
Prometheus is not scraping metrics
Check the following:
- The Gateway Service includes the correct Prometheus scrape annotations.
- Port
8000is exposed and reachable. - The configured scrape scheme matches your deployment:
httporhttps. - Network policies allow Prometheus to reach the Gateway Service.
Metrics from removed pods still appear
When a Gateway pod is removed, it stops exposing metrics. Some monitoring systems may keep the last time series until it becomes stale.
This is expected behavior and does not mean the pod is still running.
HTTP status code values keep increasing
akeyless_gw_system_http_response_status_code is a counter. Counter values are expected to increase over time.
Use rate() or increase() to calculate changes over a time window.
Example:
sum by (status_code) (
  increase(akeyless_gw_system_http_response_status_code[5m])
)
Related Pages
Updated about 1 month ago