Telemetry and Metrics
For Docker Environment
Akeyless Gateway telemetry metrics can be consumed by well-known monitoring and alerting solutions, such as Datadog and Prometheus. You can find a full list of supported exporters on the OpenTelemetry Collector Contrib exporter page.
Telemetry metrics are time-series signals from the Gateway application and runtime environment, used for dashboards, alerting, and trend analysis.
The following metrics are currently available:
| Metric | Description |
|---|---|
akeyless.gw.system.cpu.* | CPU utilization metrics |
akeyless.gw.system.disk.* | Disk I/O metrics |
akeyless.gw.system.load.* | CPU load metrics |
akeyless.gw.system.memory.* | Memory utilization metrics |
akeyless.gw.system.network.* | Network interface I/O metrics and TCP connection metrics |
akeyless.gw.system.saas.connection_status | Monitor Gateway connectivity to Akeyless SaaS services. |
akeyless.gw.quota.current_transactions_number | Current total transaction count in the account |
akeyless.gw.quota.gw_admin_client_transactions | Total transactions made by the Gateway default identity |
akeyless.gw.quota.total_transactions_limit | Total transaction limit per hour in the account |
akeyless.gw.system.http_response_status_code | HTTP response status codes for requests served by the Gateway API |
akeyless.gw.system.request_count | Total requests issued directly against the Gateway API |
akeyless.gw.system.healthcheck.status | Container health check status |
Health and Connection Status Values
The following metrics are numeric status metrics:
akeyless.gw.system.healthcheck.statusakeyless.gw.system.saas.connection_status
Use the values below when building dashboards and alerts:
1= healthy/connected0= unhealthy/not connected
What Each Metric Checks
akeyless.gw.system.saas.connection_status: Checks connectivity from each Gateway pod to Akeyless SaaS backend services.akeyless.gw.system.healthcheck.status: Checks connectivity from each Gateway pod to the local cache service (Redis/Supersonic cache).
These are per-pod metrics. They are not replica counters.
Replica Scaling Behavior
When you scale from 2 replicas to 1 replica, a healthy remaining pod still reports 1.
The removed pod stops exposing metrics, so its time series becomes stale. This behavior does not mean the metric is stuck.
For replica-count alerts, use Kubernetes metrics such as kube_deployment_status_replicas_available.
HTTP Response Metric Behavior
akeyless.gw.system.http_response_status_code is a counter with status-code labels.
Use rate() or increase() in PromQL for alerting and dashboard calculations, rather than using raw counter values.
In addition to these metrics, Gateway application logs can be forwarded through OpenTelemetry.
Datadog (Docker)
To enable telemetry metrics on Docker for Datadog, set ENABLE_METRICS=true and mount an OpenTelemetry config file such as otel-config.yaml.
exporters:
  datadog:
    api:
      key: "<Datadog API key>"
      site: datadoghq.eu # optional. defaults to Datadog US when omitted
service:
  pipelines:
    metrics:
exporters: [datadog]docker run -d -p 8000:8000 -p 5696:5696 \
-e GATEWAY_ACCESS_ID="Access-id" \
-e GATEWAY_ACCESS_KEY="Access-key" \
-e ENABLE_METRICS="true" \
-v $PWD/otel-config.yaml:/akeyless/otel-config.yaml \
--name akeyless-gateway akeyless/base:latest-akeylessAlternatively, use METRICS_CONFIG_BASE64 with a Base64-encoded OpenTelemetry config.
Dashboard Setup
Akeyless is an official Datadog Partner and the dashboard is available in Datadog Integrations.
- In Datadog, go to Integrations and install Akeyless Gateway.
- Go to Dashboards and open the Akeyless GW dashboard.
- Use Metrics Explorer and filter by
akeyless.gwfor additional metrics.
Prometheus (Docker)
To enable telemetry metrics on Docker for Prometheus, set ENABLE_METRICS=true, expose port 8889 (or another exporter port), and mount otel-config.yaml.
exporters:
  prometheus:
    endpoint: "0.0.0.0:8889"
service:
  pipelines:
    metrics:
      exporters: [prometheus]
Add a scraping target for the Gateway container in Prometheus:
scrape_configs:
  - job_name: 'akeyless'
    scrape_interval: 10s
    static_configs:
      # docker on linux
      - targets: ['localhost:8889']
      # docker on macOS
      # - targets: ['host.docker.internal:8889']
Run the Gateway container with metrics enabled:
docker run -d -p 8000:8000 -p 5696:5696 -p 8889:8889 \
  -e GATEWAY_ACCESS_ID="Access-id" \
  -e GATEWAY_ACCESS_KEY="Access-key" \
  -e ENABLE_METRICS="true" \
  -v $PWD/otel-config.yaml:/akeyless/otel-config.yaml \
  --name akeyless-gateway akeyless/base:latest-akeyless
When scraped directly by Prometheus, metric names use underscores. For example:
akeyless_gw_system_healthcheck_statusakeyless_gw_system_saas_connection_status
In OpenTelemetry-transformed backends, these metrics can appear as dotted names (for example, akeyless.gw.system.healthcheck.status).
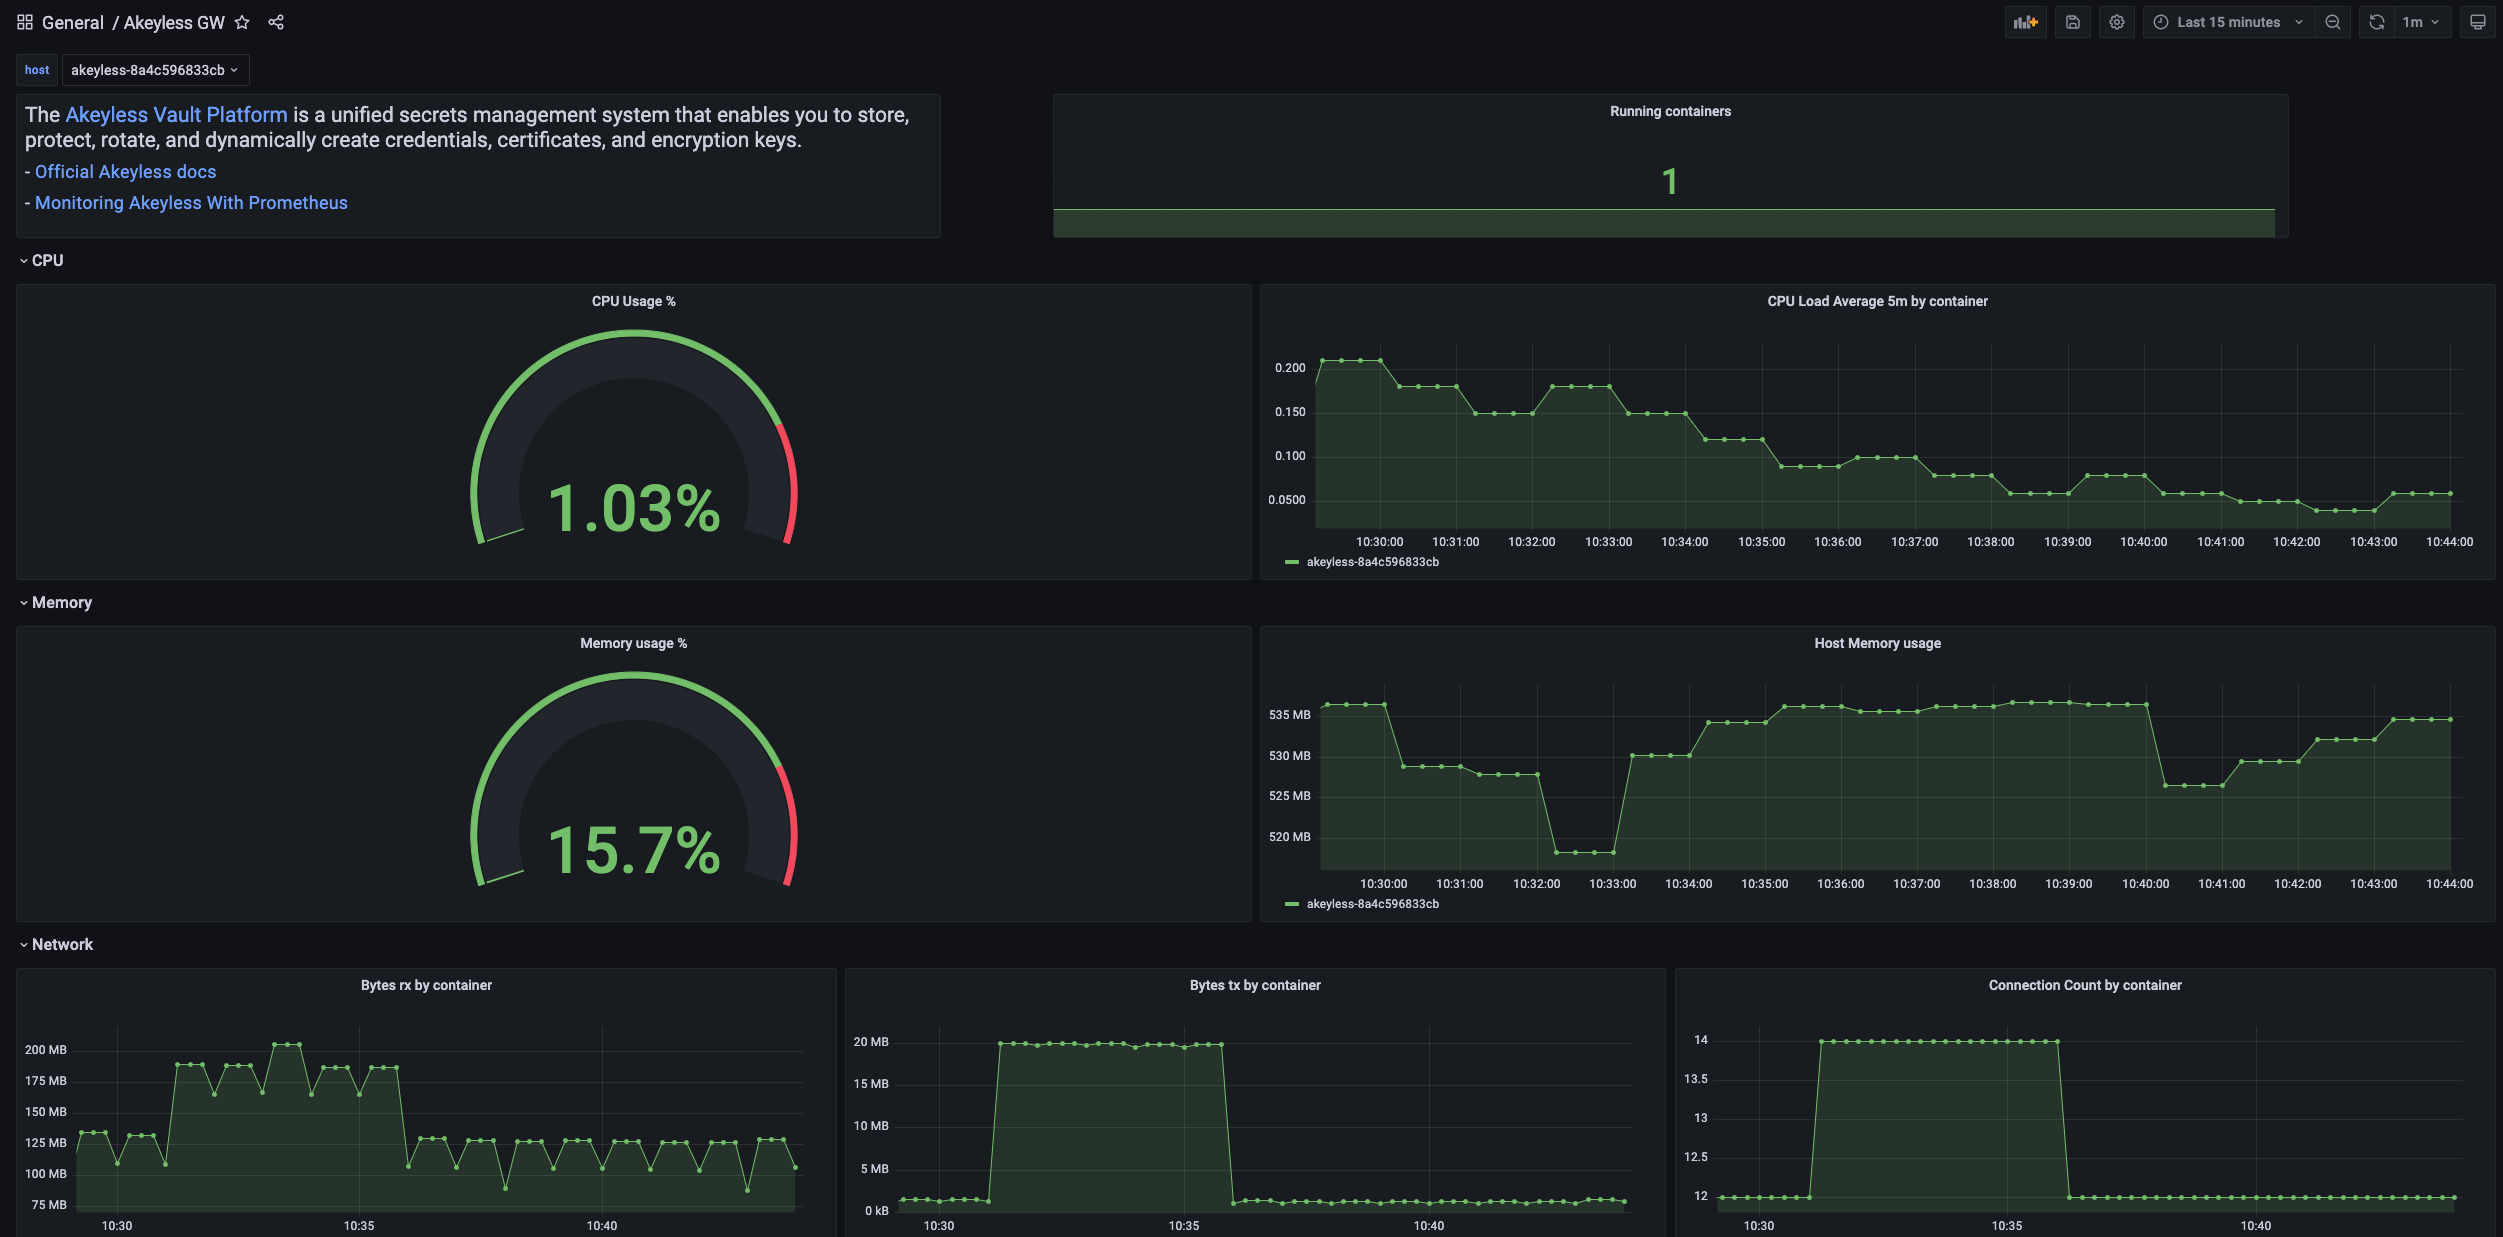
Grafana Dashboard
You can visualize Akeyless metrics in Grafana when using Prometheus as a data source.
Import the Akeyless GW dashboard using Grafana dashboard 16927.
Gateway Application Log Forwarding (Docker)
To collect Gateway application logs together with metrics, add an additional logs pipeline in otel-config.yaml.
exporters:
  prometheus:
    endpoint: "0.0.0.0:8889"
  loki:
    endpoint: "http://loki:3100/loki/api/v1/push"
service:
  pipelines:
    metrics:
      exporters: [prometheus]
    logs:
      receivers: [filelog]
      processors: [batch]
      exporters: [loki]
Enable log forwarding and mount the same telemetry config:
docker run -d -p 8000:8000 -p 5696:5696 -p 8889:8889 \
  -e GATEWAY_ACCESS_ID="Access-id" \
  -e GATEWAY_ACCESS_KEY="Access-key" \
  -e ENABLE_METRICS="true" \
  -e FORWARD_GW_APP_LOG="true" \
  -v $PWD/otel-config.yaml:/akeyless/otel-config.yaml \
  --name akeyless-gateway akeyless/base:latest-akeyless
Application logs from all instances of this Gateway are forwarded in this format:
<date> <time> <gw-clustername-instance-id> <log>.
For Loki-based analysis, add a Loki data source in Grafana and query logs from Explore.
Datadog (Kubernetes)
To enable telemetry metrics on Kubernetes for Datadog, configure the chart values.yaml under metrics.
metrics:
  enabled: true
  config: |
    exporters:
      datadog:
        api:
          key: "<Datadog API key>"
          site: <Datadog site>
    service:
      pipelines:
        metrics:
          exporters: [datadog]
If your Datadog account is in the EU site, use datadoghq.eu.
Prometheus (Kubernetes)
To enable telemetry metrics on Kubernetes for Prometheus, expose a Prometheus exporter endpoint (for example, 8889) and configure chart metrics.
service:
  annotations:
    prometheus.io/scrape: "true"
    prometheus.io/port: "8889"

metrics:
  enabled: true
  config: |
    exporters:
      prometheus:
        endpoint: "0.0.0.0:8889"
    service:
      pipelines:
        metrics:
          exporters: [prometheus]
Add a scrape target in Prometheus:
scrape_configs:
  - job_name: 'akeyless'
    scrape_interval: 10s
    static_configs:
      - targets: ['localhost:8889']
Using Kubernetes Secret for Telemetry Config
You can store OpenTelemetry configuration in a Kubernetes secret and reference it from Helm values.
Create an OpenTelemetry config file (for example, Datadog or Prometheus exporter settings), encode it to Base64, and create the secret:
apiVersion: v1
kind: Secret
metadata:
  name: gw-metrics-secret
  namespace: <your-namespace>
type: Opaque
data:
  otel-config.yaml: <base64-encoded-otel-config>
Apply the secret in the target namespace:
kubectl apply -f secret.yaml -n <your-namespace>Reference the secret from Helm values:
metrics:
  enabled: true
  existingSecretName: "gw-metrics-secret"
Gateway Application Log Forwarding (Kubernetes)
To collect Gateway application logs with metrics on Kubernetes, add a logs pipeline and set FORWARD_GW_APP_LOG=true in chart values.
metrics:
  enabled: true
  config: |
    exporters:
      prometheus:
        endpoint: "0.0.0.0:8889"
      loki:
        endpoint: "http://loki:3100/loki/api/v1/push"
    service:
      pipelines:
        metrics:
          exporters: [prometheus]
        logs:
          receivers: [filelog]
          processors: [batch]
          exporters: [loki]
env:
  - name: FORWARD_GW_APP_LOG
    value: "true"
Metric Tag Configuration
You can add tags to metrics using OpenTelemetry semantic conventions. For mapping details, see Datadog OpenTelemetry semantic mapping.
Related Pages
Updated 15 days ago